Previous Day Doji If previous day is a Doji and a Gap happens, trade in the direction of gap.
Previous Day Bullish If previous day is Bullish and Gap Up happens. Profit booking will happen and look for short opportunuties. If previous day is Bullish and Gap Down happens, Bulls will get trapped and they will try to exit. Look for short opportunitities. If previous day is Bullish and flat opening, then market will likely continue. Take long opportunities. Previous Day Bearish If previous day is Bearish and Gap Down happens. Profit booking will happen and look for long opportunuties. If previous day is Bearish and Gap Up happens, Bears will get trapped and they will try to exit. Look for long opportunitities. If previous day is Bearish and flat opening, then market will likely continue. Take short opportunities.Tuesday, November 15, 2022
Tuesday, March 1, 2022
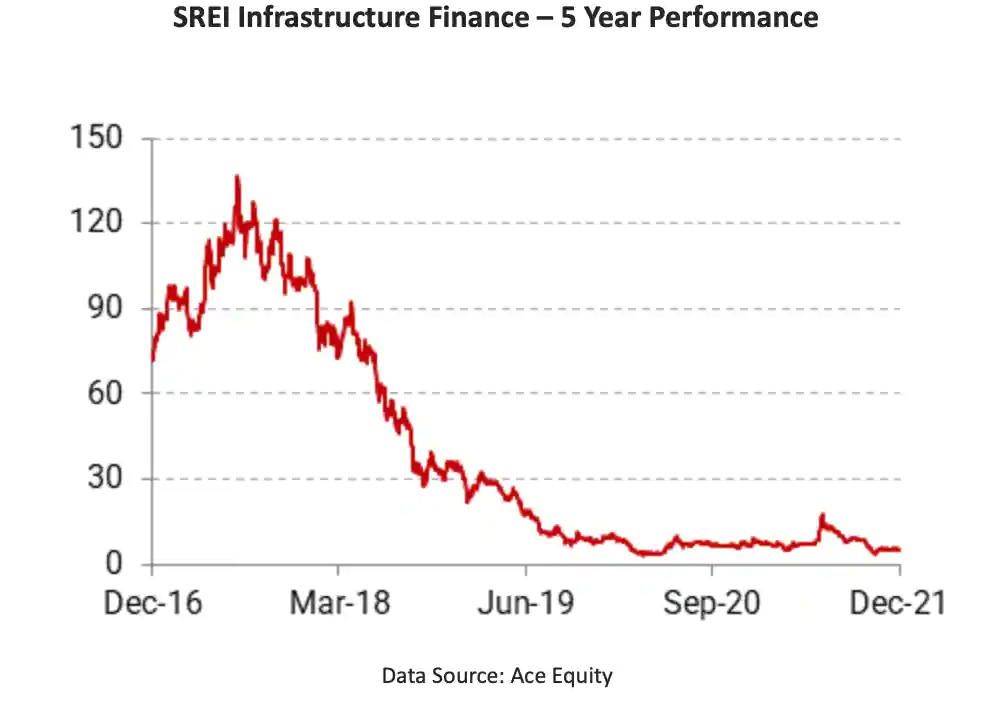
Tata Steel Long Products Ltd - A multibagger idea for long term
Tata Steel Long Products Ltd

Current price - 730.
It may reach up to 5000 in a time duration of 5 years.
P/E Expansion
Trading at just a p/e of 3. With just p/e expansion to 15, price will go to 3500 and the rest will be taken care by profits of companies.
Company has took a loan of 1400 crore and has setup machinery of 3,560 Crore. With Annual profits of approximate 350 Crore, this will get cleared in 3 years.
Future
The Company is exploring possibilities to reach the name plate capacity of 1 million tonne, coupled with investment in downstream and finishing facilities for balancing the capacity and meeting customer requirements.
Disclaimer - Please do your own research before investing. Not a SEBI registered analyst.
Disclaimer - Please do your own research before investing. Not a SEBI registered analyst.
Monday, February 28, 2022
Biggest Wealth creator and destroyer in the last 20 years in the indian stock market
Biggest Wealth Creator

- Rs 10,000 invested in Eicher Motors in 1992 is worth today - Rs 80 lacs
- Rs 10,000 invested in Asian Paints in 1986 is worth today at Rs 90 lacs
- Rs 10,000 invested in Dr Reddy’s Labs in 1986 is worth today at mindboggling Rs 10 crores.
- Rs 10,000 invested in Shree Cement in 1990 is worth today at Rs 2.90 crores.
- Rs 10,000 invested in Torrent Pharma in 2008 is worth today at Rs 2.19 lacs (approx) (that’s more than 21 times in 9 years)
- Rs 10,000 invested in Granules India in 2008 is worth today at Rs 2.97 lacs (almost 30 times in 9 years) (Stock was at Rs 28.20 back in 2008 and there was split in face value from 10 to 1 in 2015)
- Hold your breath for this one. Rs 10,000 invested in Ajanta Pharma in 2008 would be worth today at Rs 24.42 lacs. (More than 240 times in 9 years)
Barring these companies there are many companies which have grown tremendously in the last 20–30 years. We all have read about the investing returns from Infosys and Wipro over the last 3 decades.
There are companies like Bajaj Finance, BPCL, Lupin, Natco Pharma and HPCL which have delivered 50–60x over a period of last 20 years.
Biggest Wealth Destroyer


Friday, February 18, 2022
The success story of Rakesh Jhunjhunwala from 5,000Rs to 50,000CR. (10,00,000 times)

Rakesh Ji as a child was always curious about stock movement. He used to ask his father why that stock went up or down. As a child also, he was very curious and used to look at balance sheet of companies.
He wanted to directly jump into stock market after 12. His father advised him to atleast do CA in case he fails into the market, he will have a backup.
1985
Wealth - 5000Rs
After completing CA, Rakesh Ji Came to Bombay with 5000Rs.
Now, at this point, he asked his brother for help to get him some money to trade. At that point in time borrowing used to happen at around 12 percent.
He convinced 1 client who said, they will give him money at 18 percent. They promised him 2.5L with initial money of 1 lakh. As a mortgage, RakeshJi had given them the securities and his convicing words.
Wealth - 12.5L (Borrowed)
With that money, he made some success and he got his completed 2.5L. And another client gave him 10L to trade. With 12.5L, he made 30L within a year by trading. He paid a tax of 4L that year.
Wealth - 30L - (12.5L borrowed + 4 L tax) = 11 L
Then with that money, He bought SESA Goa at rate of 25 which became 65 in 4 months. His money went up to 30L with that trade.
Wealth - 30L
Then he bought Tata power at 150, which went up to 1000. That 30L became around 2-3 Crore with the help of that trade.
Wealth - 2-3 Crore.
VP singh Budget (1986)
Before the budget markets were very down, but he was very bullish. There used to be evening session on budget day 6-9PM. He had 3 Crore worth of stocks at 6 PM which became 30 Crore by 9PM. (Not sure of stock details. May be was trading F&O for this rise)
Wealth - 30 Crore.
1990s -1992 (Harshad Mehta)
His friend bought ACC at 100 and sold at 10100. This stock rights issue was not even fully subscribed 3 years back. It was so crazy.
He made some success investment in Tata tea when it was at a P/E of 90 during Harshad Mehta Scam. But, it was a successful bet for him as it was fundamentally strong stock in his opinion.
He became very bearish on markets in 1992 as markets were very highly valued. He made a lot of money during that time by shorting stocks.
He doubled his wealth in that bearish period.
Wealth - 60 Crore.
Post Scam
Year 1993 - SBI came with Ipo price of 90, got listed at 160. He shorted it a 160, Next day it went up to 240. Eventually it came down and he made money.
He bought United Spirits at 40 which became 24000 in 17 years. Due to split the price is different on exchange.
Over years, he made a successful bet on Titan and many other stocks.
Analysis - He initially borrowed money and traded on that. But, he was sure of his skill as he was looking at companies since he was a child. He was not a beginner and he was a qualified CA. He returned the money as soon as he can. We should not trade with borrowed money on reading his story.
He is both a trader and investor.
His trading style - He trades on the basis of momentum and keeps pyramiding (that is keep buying) when the stock moves in his favour. He never averages while trading and take a hit when the stock against him.
He never fixes a target as we never know till what level stock will go. He only gets out if it looks way overvalued and far stretched. We can trade in any time frame for trading as per his view.
He has made money in trading in certain bullish periods - 89-92, 2003-07, 2009-11.
While investing, he does averaging sometimes with buying stocks in a staggered manner. If only the stock is going down and not the overall market.
If the overall market is looking bearish, he will lighten his position in staggered manner and sit on cash until the direction changes.
Monday, February 15, 2021
Is it better to stay invested in market or buying when there is a dip using the accumulated amount ?
Can we make more money by investing only when the market falls by more than 5 percent ?
Idea sounds good until we take a look at the numbers. But, don't forget we might also miss some good market runs if we don't invest.
I tested the monthly data from Jan 2009 to Jan 2021. Making investment at the end of month, we acccumulated 10191 Niftybees whose value at the end of Jan 2021 was 14.8 Lakh.
Total amount invested was 7.19 Lakhs.
But, if we keep on accumulating the money and invest only when the market falls by more than 5 percent. We had 9260 Niftybees whose value is 13.52 Lakhs.
If we keep SIP on, we will make 9.46 percent more returns in NIFTYBEES.
I have not considered any returns on the accumulated money that is lying idle in the bank. If we consider that too, more or less returns will be same.
Excel Numbers

Saturday, February 13, 2021
Can I make money by shorting Nifty Calls and buying Niftybees ?
This idea sounds great to pocket the premium by selling nifty option calls and saving ourselves by buying equivalent Niftybees.
Lets see the actual returns that we will make.
As of today, Nifty is at 15163. Lets say we try to take premium out of April call.
We will short NIfty 14000 CE which is at 1419, we will get 14000 + 1419 - 15163 = 256 points out of this. One lot is of 75 size, so we will pocket 256 * 75 = 19200 Rs in 2.5 months.
But, we need to save ourselves from losses, so we will buy equivalent niftybees.
(15163 * 75) which is Rs. 1137225.
Plus, we will margin for shorting nifty call which is approx 26200 as of now.
Total money required to pocket premium = 1137225 + 26200 = 1399225 ~ 14 Lakh.
You will make 19200 on 14 Lakh which is 1.3 percent.
You are making 1.3 percent in 2.5 months. In an year, you will make approx 6.24 percent.
Note - We can try this checking with far OTM calls but we need to contain the risk too that's why I went with Deep ITM call.
I think its better to buy plain niftybees which gave 12 percent CAGR in last 10 years or 16% CAGR since inception.
https://www.moneycontrol.com/mutual-funds/nav/nippon-india-etf-nifty-bees/MBM001
Monday, October 2, 2017
How to check institutional holding of stocks
This link will give you the list of stocks with highest FII holding.
https://trendlyne.com/stock-screeners/shareholding/FII/increase/Q2-2017/index/BSEAllCap/s-p-bse-allcap/
You can sort them on the basis of change in the holding in the recent quarter. You can expect good returns from the stocks which has good FII holding.
Use this for DII.
https://trendlyne.com/stock-screeners/shareholding/Institutions/increase/now/index/BSE500/bse-500/
Stocks with good FII holding will also perform well.
Friday, June 2, 2017
Why trade breakouts?
Why trade breakouts?
At first, when buying breakouts it looks contradictory to the idea of buying low and selling high. But, it is still advisable to buy breakouts because it gets you on the right side of the market. We should not fight the trend. Markets can remain irrational longer than you can remain solvent.
To improve accuracy on breakouts, we can use the moving averages.
If the prices are above 8EMA, 21 EMA and 8EMA > 21 EMA. Trade breakouts and vice versa for break downs.
Trading 52 week high breakouts is also profitable.
Saturday, December 31, 2016
Analysis of Nifty
Data Tested from 2-Aug-2010 to 29 July 2016.
Is gap up a good buying opportunity?
Among the tested 1503 trading days, Nifty gapped up 761 times.
The total of close-open comes out -26454 points on those 761. It's not a good decision to buy on gap up, we should look for short opportunity.
HISTOGRAM
Bin Frequency
-180 15
-160 3
-140 7
-120 29
-100 24
-80 51
-60 65
-40 115
-20 134
0 891
20 83
40 46
60 19
80 12
100 4
120 2
140 1
160 0
180 0
More 0
Among the tested 1503 trading days, Nifty gapped down 742 times.
The total of open-close comes out -19798 points on those 742 days. It's a good decision to sell on gap down.
HISTOGRAM
Bin Frequency
-180 2
-160 2
-140 7
-120 12
-100 27
-80 47
-60 73
-40 93
-20 126
0 911
20 98
40 58
60 27
80 11
100 6
120 0
140 1
160 0
180 0
More 0
Analysis of nifty from 2-Aug-2010 to 29 July 2016.
(Close - open) and their frequency w.r.t bin.
Simple Histogram
Bin Frequency
-180 15
-160 3
-140 7
-120 30
-100 24
-80 57
-60 76
-40 142
-20 192
0 276
20 206
40 172
60 113
80 84
100 51
120 29
140 13
160 7
180 2
More 2
Fat Tails
High -low and their frequency.
20 0
40 124
60 349
80 340
100 262
120 165
140 84
160 65
180 33
200 15
220 8
240 9
260 5
280 1
300 1
More 2
Is it a good idea a buy on gap up days ?
Among 2279 days, nifty gapped up by more than 20 pts. for 472 days.
The sum of close-open for those days is -1445.
Is it a good idea to sell on gap down days ?
Gap down 227 days. Among those 227 days, 116 days open-close was positive.
Sum of open-close for those 227 days is -39.
Does market follow the previous day ?
1068 days market closed on positive side. 516 days followed.
1173 days market closed negative. 626 days followed.
I tried checking if nifty closed more than +40 and +60. Did the next day followed ? Same result only 50% days.
If we see all the figures so far, we came to see that markets are fairly balanced this way.
Simple Stats of Nifty (2007 - 2016)
If Nifty opens within PDR, it has 50% probability of closing within the range
If Nifty opens abv PDH, it has 60% probability of closing abv PDH
If Nifty opens blw PDL, it has 60% probability of closing blw PDL
If Nifty opens above PDC, 60% probability of closing above PDC
If Nifty opens below PDC, 60% probability of closing below PDC
Is gap up a good buying opportunity?
Among the tested 1503 trading days, Nifty gapped up 761 times.
The total of close-open comes out -26454 points on those 761. It's not a good decision to buy on gap up, we should look for short opportunity.
HISTOGRAM
Bin Frequency
-180 15
-160 3
-140 7
-120 29
-100 24
-80 51
-60 65
-40 115
-20 134
0 891
20 83
40 46
60 19
80 12
100 4
120 2
140 1
160 0
180 0
More 0
Among the tested 1503 trading days, Nifty gapped down 742 times.
The total of open-close comes out -19798 points on those 742 days. It's a good decision to sell on gap down.
HISTOGRAM
Bin Frequency
-180 2
-160 2
-140 7
-120 12
-100 27
-80 47
-60 73
-40 93
-20 126
0 911
20 98
40 58
60 27
80 11
100 6
120 0
140 1
160 0
180 0
More 0
Analysis of nifty from 2-Aug-2010 to 29 July 2016.
(Close - open) and their frequency w.r.t bin.
Simple Histogram
Bin Frequency
-180 15
-160 3
-140 7
-120 30
-100 24
-80 57
-60 76
-40 142
-20 192
0 276
20 206
40 172
60 113
80 84
100 51
120 29
140 13
160 7
180 2
More 2
Fat Tails
High -low and their frequency.
20 0
40 124
60 349
80 340
100 262
120 165
140 84
160 65
180 33
200 15
220 8
240 9
260 5
280 1
300 1
More 2
Tested Data from 18/9/2007 to 18/11/2016
2279 Trading days
PDH = previous day high
PDL = previous day low.
Nifty crossed the PDH.
1208 days it crossed the PDH. Among those 1208, 691 days it closed above the PDH.
But, in all 1208 days , the sum of close-PDH is 10921.
So, its good to trade the breakout of PDH.
Nifty crossed the PDL.
1083 days it crossed the PD low. Among those, 605 days it closed low.
Sum of PD low-close is 14113. But, we should look for failure too. One day it was -416 points.
It shows if nifty crosses the pdh/pdl it will close in that direction for 55% of the days.
Is it a good idea a buy on gap up days ?
Among 2279 days, nifty gapped up by more than 20 pts. for 472 days.
The sum of close-open for those days is -1445.
Is it a good idea to sell on gap down days ?
Gap down 227 days. Among those 227 days, 116 days open-close was positive.
Sum of open-close for those 227 days is -39.
Does market follow the previous day ?
1068 days market closed on positive side. 516 days followed.
1173 days market closed negative. 626 days followed.
I tried checking if nifty closed more than +40 and +60. Did the next day followed ? Same result only 50% days.
If we see all the figures so far, we came to see that markets are fairly balanced this way.
Simple Stats of Nifty (2007 - 2016)
If Nifty opens within PDR, it has 50% probability of closing within the range
If Nifty opens abv PDH, it has 60% probability of closing abv PDH
If Nifty opens blw PDL, it has 60% probability of closing blw PDL
If Nifty opens above PDC, 60% probability of closing above PDC
If Nifty opens below PDC, 60% probability of closing below PDC
Trading stocks that open with a gap and do they trend
Markets are random by nature. We have to look for events where the market will behave in a non random fashion.
Take the stocks which opened with a gap of more than 2%, then wait for 5/15 minutes for the stock to set the opening range. Then, take the trade in the direction which is showing strength.
For analysis purpose, lets start with gap up of more than 2%, does the stock rise? Data tested from 2012.
StockName , Sum of (close-open) %, Sum of abs(close-open)%, No of trades in 4 years
Total trades : 4255
Total sum of % change(2nd column) : -5031%. Gaps getting filled.
Total sum of abs change : 12570.
2.95% change per trade.
The results look, stocks seem to be trending after a gap up.
Let's take a look from the gap down of more than 2%.
StockName, sum of % Change open -close, Sum of absolute % change open-close, no of trades
In gap down, movement is good.
Total trades : 2984.
Total sum of open -close % (2nd column): -4069. => Gaps filled.
Sum of absolute change(3rd column) : 10252.
It shows a movement of 3.43% per trade.
The above also shows gaps are often filled. Now, further study needs to be done on the Opening range breakout on the stocks with a gap.
Take the stocks which opened with a gap of more than 2%, then wait for 5/15 minutes for the stock to set the opening range. Then, take the trade in the direction which is showing strength.
For analysis purpose, lets start with gap up of more than 2%, does the stock rise? Data tested from 2012.
StockName , Sum of (close-open) %, Sum of abs(close-open)%, No of trades in 4 years
| JPASSOCIAT | -27.32610219 | 186.49 | 49 |
| HDIL | 6.918107082 | 112.75 | 35 |
| ARVIND | -15.62888451 | 37.44 | 10 |
| ADANIENT | -5.435449073 | 54.09 | 18 |
| HAVELLS | -21.25835332 | 41.05 | 9 |
| MARICO | -39.96573965 | 59.93 | 21 |
| INDIACEM | -68.85385005 | 124.15 | 37 |
| ORIENTBANK | -42.11056829 | 115.61 | 36 |
| AUROPHARMA | -46.51498804 | 91.83 | 20 |
| ABIRLANUVO | -12.20098535 | 41.41 | 16 |
| HINDPETRO | -22.54552241 | 80.6 | 29 |
| LTFH | -26.20525764 | 86.26 | 35 |
| TORNTPHARM | -65.52778734 | 95.43 | 40 |
| BOSCHLTD | -18.62853516 | 37.35 | 18 |
| JISLJALEQS | -43.31868274 | 101.4 | 28 |
| GMRINFRA | -87.8594496 | 172.09 | 61 |
| GAIL | -12.51424082 | 21.94 | 12 |
| JUBLFOOD | -4.557456022 | 22.45 | 7 |
| SRTRANSFIN | 2.299413528 | 46.95 | 15 |
| SINTEX | -23.85124559 | 98.82 | 37 |
| SIEMENS | -15.55014222 | 21.18 | 10 |
| SUNPHARMA | -2.391231081 | 22.7 | 14 |
| JUSTDIAL | -15.71188357 | 50.5 | 14 |
| ITC | 2.886965737 | 5.11 | 3 |
| APOLLOHOSP | -37.66990604 | 38.11 | 13 |
| POWERGRID | 0 | 0 | 0 |
| GRASIM | 11.04174322 | 11.19 | 4 |
| INFY | -2.500189208 | 38.98 | 14 |
| IGL | -13.85018987 | 42.93 | 14 |
| RPOWER | -18.61653415 | 39.83 | 24 |
| BHEL | 16.12160525 | 45.63 | 20 |
| GODREJCP | -89.51885313 | 90.26 | 28 |
| BEML | -14.88913373 | 58.07 | 33 |
| PNB | -28.62738614 | 59.73 | 18 |
| TATACOMM | -19.49069376 | 88.32 | 32 |
| OIL | -52.08247373 | 53.01 | 22 |
| NIITTECH | -64.8338293 | 88.24 | 29 |
| ALBK | -13.04923915 | 58.39 | 24 |
| IDEA | -33.27583111 | 47.3 | 17 |
| CROMPGREAV | -49.9852008 | 71.38 | 24 |
| IDFCBANK | -9.65067349 | 9.65 | 7 |
| TATACHEM | -20.10151924 | 25.29 | 13 |
| BANKINDIA | -41.17012134 | 108.86 | 36 |
| RCOM | 4.287864937 | 80.79 | 26 |
| MCDOWELL_N | -5.030194248 | 94 | 21 |
| JSWENERGY | -19.23503614 | 149.36 | 40 |
| ICICIBANK | 8.120235266 | 39.84 | 26 |
| TITAN | -17.77907956 | 59.17 | 17 |
| IBREALEST | 28.64923837 | 197.22 | 52 |
| DISHTV | -7.809799645 | 49.45 | 21 |
| RELINFRA | 17.08722569 | 44.91 | 21 |
| ACC | 3.485578844 | 3.49 | 2 |
| RELCAPITAL | 15.13681549 | 75.17 | 28 |
| RELIANCE | 5.448744172 | 25.64 | 13 |
| TATAELXSI | -19.61787874 | 26.67 | 13 |
| UPL | 3.918800681 | 5.79 | 4 |
| RECLTD | 14.44721147 | 41.51 | 18 |
| AXISBANK | -2.395651934 | 55.77 | 28 |
| JETAIRWAYS | -48.34884996 | 196.7 | 55 |
| EICHERMOT | -74.99507894 | 129.14 | 51 |
| JSWSTEEL | 12.25074036 | 20.77 | 7 |
| SOUTHBANK | -95.69516029 | 120.74 | 35 |
| ASHOKLEY | -101.8843838 | 168.37 | 56 |
| CADILAHC | -50.51199764 | 54.84 | 18 |
| BANKBARODA | -6.932646783 | 67.95 | 21 |
| BAJFINANCE | -40.38318483 | 78.94 | 38 |
| ZEEL | -20.52294228 | 30.8 | 11 |
| IRB | -34.8279921 | 91.9 | 37 |
| TECHM | -45.58843225 | 69.61 | 18 |
| ASIANPAINT | -5.630510755 | 5.63 | 3 |
| WOCKPHARMA | -72.70258187 | 154.88 | 56 |
| SBIN | -13.41877562 | 57 | 23 |
| COLPAL | -44.48511644 | 46.1 | 14 |
| LUPIN | -26.44000687 | 29.67 | 11 |
| GODREJIND | -37.92813947 | 70.67 | 19 |
| ADANIPORTS | -20.03265154 | 69.62 | 21 |
| ANDHRABANK | -17.37331468 | 75.96 | 25 |
| ULTRACEMCO | -8.093124692 | 31.9 | 13 |
| IBULHSGFIN | 3.853731371 | 41.68 | 13 |
| AMBUJACEM | 7.75268395 | 8.37 | 5 |
| NCC | -92.74904606 | 310.37 | 76 |
| FEDERALBNK | -61.58029764 | 92.88 | 37 |
| TATAMTRDVR | -13.29062406 | 53.31 | 28 |
| AJANTPHARM | -50.48423589 | 66.21 | 32 |
| HINDUNILVR | -4.30677195 | 27.83 | 7 |
| BHARTIARTL | -2.760943506 | 41.24 | 19 |
| NTPC | 7.108794797 | 13.48 | 6 |
| HEXAWARE | -0.178899116 | 68.13 | 28 |
| CANBK | -12.01056846 | 87.46 | 28 |
| PFC | 2.759165233 | 85.42 | 25 |
| CUMMINSIND | -55.84490326 | 68.18 | 26 |
| INFRATEL | -40.9635048 | 70.71 | 20 |
| SRF | -46.21250814 | 106.32 | 38 |
| EXIDEIND | -21.66887638 | 35.29 | 13 |
| TATAGLOBAL | -25.69903946 | 52.64 | 17 |
| TATAPOWER | -13.91952694 | 34.76 | 17 |
| WIPRO | -5.162923704 | 16.2 | 10 |
| LT | 18.5049291 | 26.18 | 13 |
| HCLTECH | -16.32849032 | 21.52 | 10 |
| DABUR | -31.31283597 | 38.9 | 11 |
| SYNDIBANK | -34.42217561 | 88.31 | 31 |
| CASTROLIND | 3.103825563 | 10.8 | 2 |
| SUNTV | -7.577627704 | 62.85 | 20 |
| TCS | -5.647374233 | 24.04 | 12 |
| COALINDIA | -17.60770549 | 23.05 | 10 |
| YESBANK | 19.03962631 | 109.24 | 35 |
| KOTAKBANK | -16.81416131 | 36.62 | 16 |
| DLF | 51.90427002 | 110.47 | 40 |
| BEL | -44.58298807 | 92.13 | 29 |
| CESC | -16.95623089 | 35.82 | 15 |
| TORNTPOWER | -49.25612942 | 90.26 | 30 |
| KPIT | -32.02608543 | 93.03 | 37 |
| UNIONBANK | -34.17727551 | 87.42 | 25 |
| NMDC | -6.231011045 | 39.84 | 17 |
| GRANULES | -75.89438033 | 201.04 | 55 |
| MM | -6.308605213 | 11.57 | 6 |
| CIPLA | -11.26761811 | 15.09 | 9 |
| OFSS | -22.42548012 | 30.39 | 16 |
| PTC | -6.489572282 | 80.5 | 32 |
| HDFC | -12.51945461 | 27.48 | 11 |
| CEATLTD | -45.521239 | 69.88 | 25 |
| PETRONET | -20.16833721 | 23.07 | 11 |
| GLENMARK | -26.93497808 | 56.51 | 19 |
| IDBI | -43.48651127 | 77.21 | 30 |
| KSCL | -131.629617 | 209.67 | 79 |
| ICIL | -731.3678047 | 1110.89 | 246 |
| INDUSINDBK | -44.40555381 | 75.31 | 27 |
| CAIRN | -21.22236281 | 57.47 | 22 |
| BIOCON | -12.68110054 | 23.31 | 11 |
| LICHSGFIN | -5.347311302 | 52.09 | 21 |
| BHARATFORG | -17.4231582 | 46.18 | 20 |
| MCLEODRUSS | -62.04295853 | 89.38 | 23 |
| HINDALCO | -16.38579565 | 47.39 | 24 |
| CONCOR | -95.64042868 | 117.35 | 40 |
| MARUTI | -1.171339638 | 23.72 | 8 |
| IOC | -49.4409745 | 61.85 | 22 |
| PCJEWELLER | -82.93014342 | 175.21 | 47 |
| DCBBANK | 3.362272377 | 44.64 | 19 |
| BRITANNIA | -21.58679726 | 45.79 | 19 |
| PIDILITIND | -43.36076451 | 50.15 | 22 |
| HEROMOTOCO | -20.27581526 | 20.28 | 8 |
| PAGEIND | -84.75346482 | 97.97 | 39 |
| NHPC | -74.29842794 | 98.13 | 27 |
| HDFCBANK | -11.14099193 | 24.33 | 10 |
| TATAMOTORS | 19.41665744 | 42.91 | 29 |
| BATAINDIA | -5.230801989 | 12.75 | 6 |
| CENTURYTEX | 1.969653423 | 36.08 | 18 |
| VEDL | 3.633897425 | 49 | 16 |
| APOLLOTYRE | -50.73160818 | 59.29 | 20 |
| DRREDDY | -8.280705509 | 10.73 | 6 |
| TATASTEEL | -1.797890652 | 52.01 | 22 |
| MRF | -21.95918899 | 26.92 | 13 |
| DHFL | 21.59590695 | 52.31 | 13 |
| AMARAJABAT | -4.439943169 | 60.91 | 18 |
| ONGC | 3.323130734 | 47.41 | 21 |
| MOTHERSUMI | -43.79802951 | 70.95 | 32 |
| KTKBANK | -43.05275324 | 82.55 | 35 |
| HINDZINC | -54.70236533 | 68.74 | 23 |
| STAR | -70.41790671 | 80.6 | 21 |
| ADANIPOWER | -56.99759995 | 113.94 | 45 |
| BAJAJ_AUTO | -10.34207351 | 14.3 | 7 |
| SAIL | 1.993593884 | 47.59 | 22 |
| TV18BRDCST | -61.1422626 | 226.33 | 55 |
| BPCL | 2.311829919 | 54.47 | 21 |
| MINDTREE | -45.91844294 | 64.12 | 28 |
| DIVISLAB | -24.82082949 | 45.18 | 15 |
| JINDALSTEL | -23.03375172 | 95.34 | 30 |
| UBL | -51.5736475 | 58.57 | 18 |
| VOLTAS | -22.43468784 | 76.88 | 23 |
| MMFIN | -64.98440681 | 93.73 | 30 |
| BHARATFIN | 0 | 0 | 0 |
| TVSMOTOR | -140.0207785 | 183.65 | 50 |
| IFCI | -23.62337616 | 104.79 | 37 |
| IDFC | -3.258244886 | 81.15 | 27 |
Total trades : 4255
Total sum of % change(2nd column) : -5031%. Gaps getting filled.
Total sum of abs change : 12570.
2.95% change per trade.
The results look, stocks seem to be trending after a gap up.
Let's take a look from the gap down of more than 2%.
StockName, sum of % Change open -close, Sum of absolute % change open-close, no of trades
| JPASSOCIAT | 16.2 | 138.15 | 39 |
| HDIL | -2.96 | 161.84 | 36 |
| ARVIND | -6.44 | 29.34 | 12 |
| ADANIENT | 72.16 | 143.45 | 17 |
| HAVELLS | -18.38 | 36.78 | 10 |
| MARICO | -11.42 | 18.29 | 10 |
| INDIACEM | -64.62 | 115.8 | 32 |
| ORIENTBANK | -2.53 | 66.61 | 25 |
| AUROPHARMA | -23.99 | 55.85 | 19 |
| ABIRLANUVO | -11.69 | 51.2 | 13 |
| HINDPETRO | -30.11 | 71.26 | 14.00 |
| LTFH | -13.61 | 36.1 | 13 |
| TORNTPHARM | -57.08 | 90.08 | 28 |
| BOSCHLTD | -6.75 | 12.81 | 5.00 |
| JISLJALEQS | -12.28 | 81.72 | 24.00 |
| GMRINFRA | -39.73 | 114.21 | 39 |
| GAIL | -7.41 | 10.16 | 8 |
| JUBLFOOD | -24.72 | 35.6 | 10 |
| SRTRANSFIN | -32.07 | 75.41 | 19 |
| SINTEX | -12.97 | 82.87 | 23 |
| SIEMENS | -4.12 | 7.48 | 4 |
| SUNPHARMA | -5.05 | 28.73 | 13.00 |
| JUSTDIAL | -1.02 | 43.47 | 14 |
| ITC | -3.41 | 3.41 | 2 |
| APOLLOHOSP | -7.38 | 18.79 | 7 |
| POWERGRID | -0.35 | 16.51 | 4.00 |
| GRASIM | -1.84 | 7.53 | 3 |
| INFY | 30.27 | 41.48 | 13 |
| IGL | 19.36 | 29.16 | 4 |
| RPOWER | 15.21 | 28.12 | 9 |
| BHEL | 12.52 | 49.57 | 13 |
| GODREJCP | -73.45 | 73.6 | 12 |
| BEML | -25.02 | 66.62 | 29.00 |
| PNB | -5.9 | 44.52 | 15 |
| TATACOMM | -15.53 | 39.11 | 12 |
| OIL | -4.99 | 26.61 | 13 |
| NIITTECH | -55.04 | 80.99 | 33 |
| ALBK | -28.98 | 52.1 | 15 |
| IDEA | -50.62 | 63.75 | 20 |
| CROMPGREAV | -33.62 | 69.57 | 20 |
| IDFCBANK | 7.53 | 7.53 | 3 |
| TATACHEM | -4.15 | 26.9 | 10 |
| BANKINDIA | 11.92 | 62.87 | 22 |
| RCOM | -16.65 | 71.49 | 17 |
| MCDOWELL_N | -73.52 | 94.45 | 18 |
| JSWENERGY | -63.17 | 110.63 | 32.00 |
| ICICIBANK | 5.25 | 22.88 | 12 |
| TITAN | -17.36 | 50.7 | 13 |
| IBREALEST | 3.02 | 101.82 | 28 |
| DISHTV | -55.98 | 82.05 | 23 |
| RELINFRA | 3.78 | 56.11 | 12 |
| ACC | -17.73 | 17.73 | 7 |
| RELCAPITAL | -10.72 | 54.21 | 14.00 |
| RELIANCE | 5.25 | 9.67 | 4 |
| TATAELXSI | -45.87 | 83.96 | 21.00 |
| UPL | 12.34 | 18.19 | 7.00 |
| RECLTD | 5.25 | 48.94 | 16 |
| AXISBANK | 16.94 | 52.21 | 19 |
| JETAIRWAYS | -49.46 | 116.18 | 31 |
| EICHERMOT | -16.46 | 43.68 | 16 |
| JSWSTEEL | -21.74 | 35.55 | 9.00 |
| SOUTHBANK | -51.65 | 52.89 | 14.00 |
| ASHOKLEY | -113.38 | 139.88 | 31 |
| CADILAHC | -14.19 | 28.52 | 12 |
| BANKBARODA | -19.2 | 33.22 | 14 |
| BAJFINANCE | -45.48 | 65.37 | 20 |
| ZEEL | -23.64 | 31.22 | 12 |
| IRB | -7.85 | 88.96 | 25 |
| TECHM | -17.76 | 47.19 | 16 |
| ASIANPAINT | 7.40 | 8.27 | 6 |
| WOCKPHARMA | -96.04 | 160.31 | 51 |
| SBIN | -16.88 | 39.62 | 14 |
| COLPAL | -30.54 | 32.97 | 10 |
| LUPIN | -34.55 | 39.57 | 11 |
| GODREJIND | -27.51 | 51.15 | 10.00 |
| ADANIPORTS | -38.8 | 56.6 | 17 |
| ANDHRABANK | -9.44 | 50.66 | 15 |
| ULTRACEMCO | -40.18 | 42.18 | 12 |
| IBULHSGFIN | -6.78 | 53.94 | 21.00 |
| AMBUJACEM | -14.61 | 21.71 | 11 |
| NCC | -18.15 | 133.37 | 35 |
| FEDERALBNK | -9.07 | 42.56 | 21 |
| TATAMTRDVR | -19.13 | 64.98 | 21 |
| AJANTPHARM | -14.14 | 60.45 | 18 |
| HINDUNILVR | -4.81 | 5.29 | 3.00 |
| BHARTIARTL | -17.97 | 34.59 | 10 |
| NTPC | 17.55 | 20.71 | 5 |
| HEXAWARE | -38.39 | 45.86 | 15 |
| CANBK | 8.85 | 72.95 | 23 |
| PFC | -5.41 | 32.09 | 14 |
| CUMMINSIND | -26.23 | 26.23 | 6 |
| INFRATEL | -130.12 | 164.1 | 43 |
| SRF | -31.1 | 92.87 | 29 |
| EXIDEIND | -31.19 | 37.67 | 13.00 |
| TATAGLOBAL | -38.24 | 39.55 | 11 |
| TATAPOWER | -24.2 | 42.94 | 13 |
| WIPRO | 8.29 | 31.26 | 15 |
| LT | 1.18 | 21.3 | 9 |
| HCLTECH | -2.82 | 30.99 | 15.00 |
| DABUR | -7.7 | 18.26 | 9 |
| SYNDIBANK | -3.3 | 58.34 | 20 |
| CASTROLIND | 3.89 | 7.48 | 2 |
| SUNTV | 7.93 | 95.81 | 20 |
| TCS | 7.06 | 15.86 | 10 |
| COALINDIA | -7.23 | 18.93 | 12.00 |
| YESBANK | 20.01 | 65.57 | 17 |
| KOTAKBANK | 3.41 | 17.27 | 10.00 |
| DLF | 22.64 | 130.85 | 33 |
| BEL | -33 | 58.36 | 20 |
| CESC | 9.72 | 35.97 | 11.00 |
| TORNTPOWER | -12.88 | 44.98 | 13 |
| KPIT | -41.88 | 128.09 | 20 |
| UNIONBANK | -7.25 | 91.61 | 26 |
| NMDC | -15.32 | 34.51 | 18 |
| GRANULES | -47.62 | 76.22 | 17 |
| MM | -5.85 | 19.4 | 9 |
| CIPLA | 10.63 | 10.63 | 3.00 |
| OFSS | -13.94 | 37.18 | 14 |
| PTC | -48.77 | 76.29 | 21.00 |
| HDFC | 2.82 | 9.48 | 6 |
| CEATLTD | -127.23 | 149.91 | 40.00 |
| PETRONET | -17.09 | 28.58 | 13.00 |
| GLENMARK | -26.91 | 35.52 | 15 |
| IDBI | -21.2 | 61.05 | 17 |
| KSCL | -103.22 | 119.09 | 31 |
| ICIL | -843.02 | 952.07 | 212 |
| INDUSINDBK | 3.56 | 32.62 | 11 |
| CAIRN | -1.74 | 55.87 | 20.00 |
| BIOCON | -15.66 | 30.77 | 7 |
| LICHSGFIN | -10.1 | 32.65 | 9 |
| BHARATFORG | -12.17 | 23.03 | 11 |
| MCLEODRUSS | -34.88 | 57.19 | 12 |
| HINDALCO | -26.71 | 55.35 | 22 |
| CONCOR | -30.21 | 50.34 | 21 |
| MARUTI | 3.93 | 20.72 | 9.00 |
| IOC | -33.44 | 46.33 | 17.00 |
| PCJEWELLER | -9.99 | 57.56 | 25 |
| DCBBANK | 16.39 | 28.83 | 6 |
| BRITANNIA | -47.58 | 49.86 | 8 |
| PIDILITIND | -12.76 | 19.57 | 11.00 |
| HEROMOTOCO | -8.35 | 11.47 | 6 |
| PAGEIND | -31.62 | 48.33 | 22.00 |
| NHPC | -54.90 | 56.13 | 10.00 |
| HDFCBANK | 4.90 | 5.68 | 3 |
| TATAMOTORS | 0.30 | 58.11 | 21.00 |
| BATAINDIA | -28.16 | 49.27 | 20 |
| CENTURYTEX | -17.09 | 53.88 | 16 |
| VEDL | 9.2 | 67.7 | 14 |
| APOLLOTYRE | 10.25 | 74.29 | 14 |
| DRREDDY | -6.25 | 8.79 | 5 |
| TATASTEEL | -3.53 | 46.96 | 14.00 |
| MRF | -12.71 | 16.04 | 6 |
| DHFL | -2.34 | 65.91 | 19.00 |
| AMARAJABAT | -62.64 | 76.35 | 17 |
| ONGC | -0.02 | 30.35 | 15 |
| MOTHERSUMI | -54.38 | 92.23 | 24 |
| KTKBANK | -39.68 | 76.6 | 16 |
| HINDZINC | -32.86 | 32.86 | 15 |
| STAR | -61.71 | 96.66 | 19 |
| ADANIPOWER | 8.28 | 67.00 | 21.00 |
| BAJAJ_AUTO | 4.15 | 9.59 | 5 |
| SAIL | -6.84 | 40.34 | 13.00 |
| TV18BRDCST | -38.97 | 76.3 | 29 |
| BPCL | -0.03 | 27.74 | 11 |
| MINDTREE | -23.77 | 41.19 | 14 |
| DIVISLAB | -19.01 | 19.01 | 6 |
| JINDALSTEL | -15.41 | 127.8 | 31 |
| UBL | -12.96 | 48.88 | 15 |
| VOLTAS | -45.61 | 71.98 | 24 |
| MMFIN | -30.35 | 49.92 | 14 |
| BHARATFIN | 0.00 | 0 | 0 |
| TVSMOTOR | -71.71 | 80.62 | 28 |
| IFCI | -96.71 | 167.07 | 27 |
| IDFC | 20.68 | 69.01 | 16 |
In gap down, movement is good.
Total trades : 2984.
Total sum of open -close % (2nd column): -4069. => Gaps filled.
Sum of absolute change(3rd column) : 10252.
It shows a movement of 3.43% per trade.
The above also shows gaps are often filled. Now, further study needs to be done on the Opening range breakout on the stocks with a gap.


