Showing posts with label nifty. Show all posts

Monday, February 15, 2021

Is it better to stay invested in market or buying when there is a dip using the accumulated amount ?

Can we make more money by investing only when the market falls by more than 5 percent ? 

Idea sounds good until we take a look at the numbers. But, don't forget we might also miss some good market runs if we don't invest. 

I tested the monthly data from Jan 2009 to Jan 2021.  Making investment at the end of month, we acccumulated 10191 Niftybees whose value at the end of Jan 2021 was 14.8 Lakh. 
Total amount invested was 7.19 Lakhs.

But, if we keep on accumulating the money and invest only when the market falls by more than 5 percent. We had 9260 Niftybees whose value is 13.52 Lakhs. 

If we keep SIP on, we will make 9.46 percent more returns in NIFTYBEES.

I have not considered any returns on the accumulated money that is lying idle in the bank. If we consider that too, more or less returns will be same. 


Excel Numbers 


Monday, October 2, 2017

How to check institutional holding of stocks

This link will give you the list of stocks with highest FII holding.

https://trendlyne.com/stock-screeners/shareholding/FII/increase/Q2-2017/index/BSEAllCap/s-p-bse-allcap/

You can sort them on the basis of change in the holding in the recent quarter.  You can expect good returns from the stocks which has good FII holding.

Use this for DII.

https://trendlyne.com/stock-screeners/shareholding/Institutions/increase/now/index/BSE500/bse-500/

Stocks with good FII holding will also perform well.

Saturday, December 31, 2016

Analysis of Nifty

Data Tested from 2-Aug-2010 to 29 July 2016.

Is gap up a good buying opportunity?
Among the tested 1503 trading days, Nifty gapped up 761 times.
The total of close-open comes out -26454 points on those 761. It's not a good decision to buy on gap up, we should look for short opportunity.

HISTOGRAM

Bin Frequency
-180 15
-160 3
-140 7
-120 29
-100 24
-80 51
-60 65
-40 115
-20 134
0 891
20 83
40 46
60 19
80 12
100 4
120 2
140 1
160 0
180 0
More 0


Among the tested 1503 trading days, Nifty gapped down 742 times.
The total of open-close comes out -19798 points on those 742 days. It's a good decision to sell on gap down.

HISTOGRAM
Bin Frequency
-180 2
-160 2
-140 7
-120 12
-100 27
-80 47
-60 73
-40 93
-20 126
0 911
20 98
40 58
60 27
80 11
100 6
120 0
140 1
160 0
180 0
More 0

Analysis of nifty from 2-Aug-2010 to 29 July 2016.

(Close - open) and their frequency w.r.t bin.


Simple Histogram
Bin Frequency
-180 15
-160 3
-140 7
-120 30
-100 24
-80 57
-60 76
-40 142
-20 192
0 276
20 206
40 172
60 113
80 84
100 51
120 29
140 13
160 7
180 2
More 2

Fat Tails

High -low and their frequency.
20 0
40 124
60 349
80 340
100 262
120 165
140 84
160 65
180 33
200 15
220 8
240 9
260 5
280 1
300 1
More 2 


Tested Data from 18/9/2007 to 18/11/2016
2279 Trading days

PDH = previous day high
PDL = previous day low.

Nifty crossed the PDH.
1208 days it crossed the PDH. Among those 1208, 691 days it closed above the PDH.
But, in all 1208 days , the sum of close-PDH is 10921.
So, its good to trade the breakout of PDH.

Nifty crossed the PDL.
1083 days it crossed the PD low. Among those, 605 days it closed low.
Sum of PD low-close is 14113. But, we should look for failure too. One day it was -416 points.

It shows if nifty crosses the pdh/pdl it will close in that direction for 55% of the days.


Is it a good idea a buy on gap up days ?

Among 2279 days, nifty gapped up by more than 20 pts. for 472 days.
The sum of close-open for those days is -1445.

Is it a good idea to sell on gap down days ?
Gap down 227 days. Among those 227 days, 116 days open-close was positive.
Sum of open-close for those 227 days is -39.

Does market follow the previous day ?

1068 days market closed on positive side. 516 days followed.
1173 days market closed negative. 626 days followed.

I tried checking if nifty closed more than +40 and +60. Did the next day followed ? Same result only 50% days.

If we see all the figures so far, we came to see that markets are fairly balanced this way.

Simple Stats of Nifty (2007 - 2016)
If Nifty opens within PDR, it has 50% probability of closing within the range
If Nifty opens abv PDH, it has 60% probability of closing abv PDH
If Nifty opens blw PDL, it has 60% probability of closing blw PDL

If Nifty opens above PDC, 60% probability of closing above PDC
If Nifty opens below PDC, 60% probability of closing below PDC

Wednesday, December 28, 2016

Options intraday chart for Sep 2016


Sunday, December 25, 2016

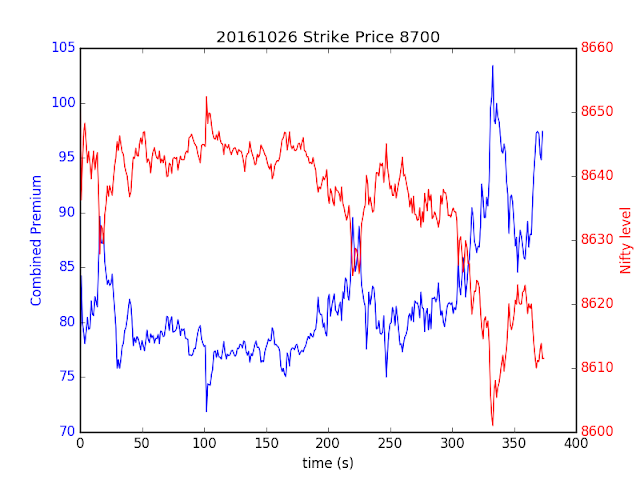
Options Intraday chart for Oct 2016


Friday, December 16, 2016

NIfty Range for the last couple of years

This graphs below are showing nifty range(high-low) for different years.


Python script for doing the same.

http://pastebin.com/6K724iv1


Wednesday, December 14, 2016

How to identify trend days

Identifying trend days

1. Few of the trend days that I observed starts with a gap. Now, it doesn't mean the market is going to close in the direction of gap. Sometimes, markets even does the opposite, it will open 100 points up and will close 100 points down.

2. First 5 min bar will be a WRB(Wide range bar - big in size) bar. 

3. The correction bars will be very small in size.

4. On some trend days it will touch the 21 ema and on some days it will maintain a distance from 21 ema.

5. It is better to wait till the end of day to extract the full juice out of it.

On those days you need to make a entry fast if a doji appears on chart by keeping SL at doji low or on pullback. Better option would be wait for pullback and make an entry when pullback gets over.

Why I am insisting on pullback?
Because some non trending days will also match the characteristics of trending day.  On sideways days, there will be many days following pt.1 and pt.2 but the pullback bars will itself be large in size and pullback will be big.

See some charts below to analyze what I am trying to say.


Tuesday, November 29, 2016

When does nifty make high and low for the day?


When does market make high?

09 represents time from 09:15 to 10:00
10 represents time from 10:00 11:00


HTML Code:
Count Time 
 404 09
 101 10
  73 11
  67 12
  86 13
 176 14
 297 15
Majority of the time markets make either in the morning or in the evening.

When does market make low?
HTML Code:
 319 09
  93 10
  85 11
 126 12
 114 13
 213 14
 252 15
It's interesting to know these stats. Don't know how can we take advantage of these figures.
What we see in the chart are the point with low time(x axis ) and (y axis ) for a day.
The x axis and y axis are actually in seconds. Like 09:16 a.m. will be 09*60+16 => 556. 

A single point represent a trading day.
X axis Low time
Y axis High time

If there is a point in the left top, that means for that trading day Nifty made the high at the end of the trading day and low at the open.

If there is a point in the right top, that means for that trading day Nifty made the high at the end of the trading day and low also at the end of the trading day. That's why chart is not dark at right top.