Identifying trend days
1. Few of the trend days that I observed starts with a gap. Now, it doesn't mean the market is going to close in the direction of gap. Sometimes, markets even does the opposite, it will open 100 points up and will close 100 points down.
2. First 5 min bar will be a WRB(Wide range bar - big in size) bar.
3. The correction bars will be very small in size.
4. On some trend days it will touch the 21 ema and on some days it will maintain a distance from 21 ema.
5. It is better to wait till the end of day to extract the full juice out of it.
On those days you need to make a entry fast if a doji appears on chart by keeping SL at doji low or on pullback. Better option would be wait for pullback and make an entry when pullback gets over.
Why I am insisting on pullback?
Because some non trending days will also match the characteristics of trending day. On sideways days, there will be many days following pt.1 and pt.2 but the pullback bars will itself be large in size and pullback will be big.
See some charts below to analyze what I am trying to say.
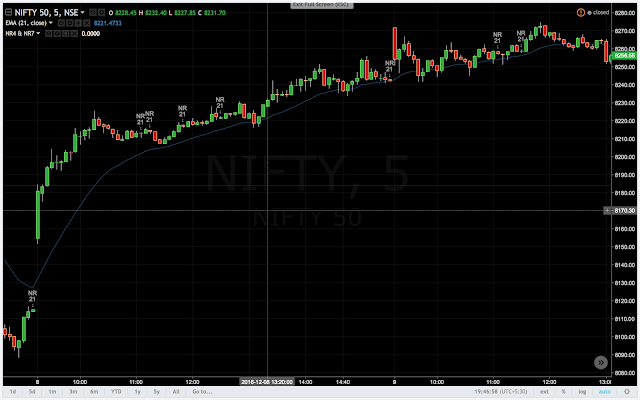


