Trade in Indian stock market
Home
Downloads
Technical Analysis by Zerodha
NSE module on Technical Analysis
Candlestick Pattern
Hammer
Shooting Star
Doji
Spinning Tops
Wednesday, December 28, 2016
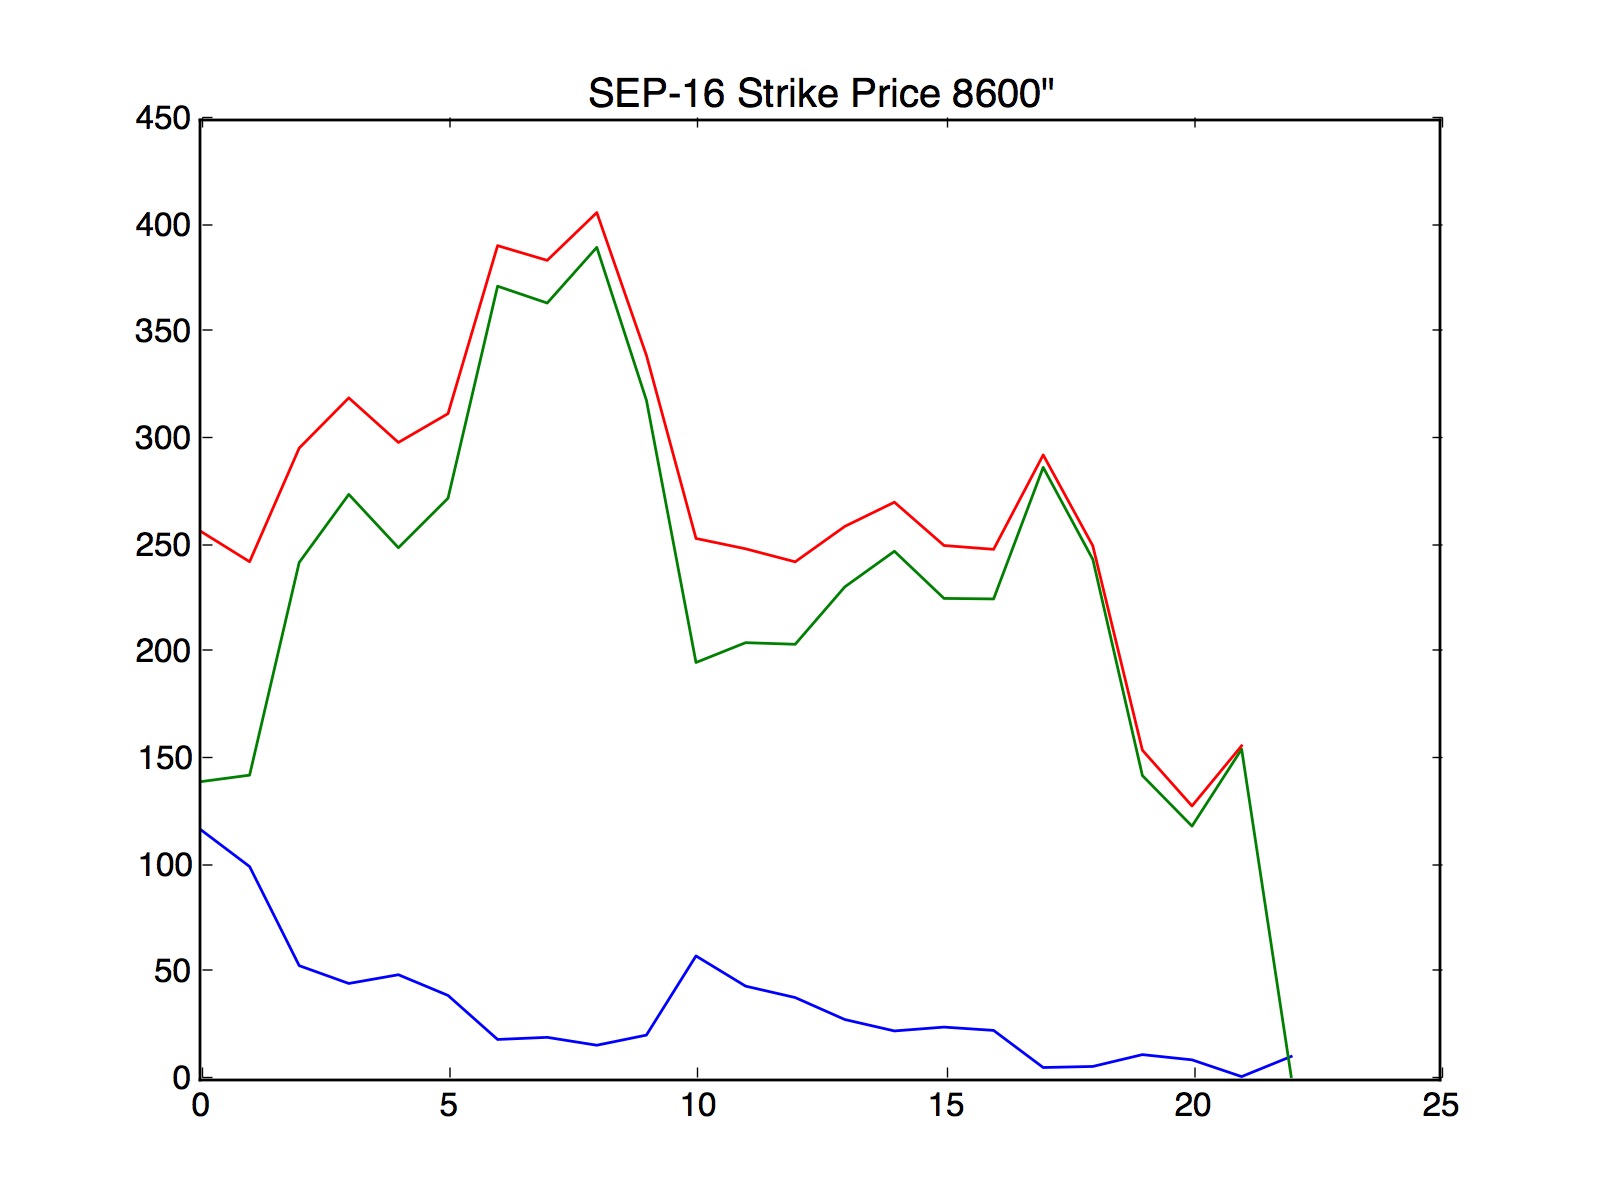
Options intraday chart for Sep 2016
8:47 AM
nifty
,
option trading
,
options
No comments
Read More
Sunday, December 25, 2016
Options Intraday chart for Oct 2016
6:02 AM
nifty
,
options
,
short straddle
No comments
Read More
Saturday, December 24, 2016
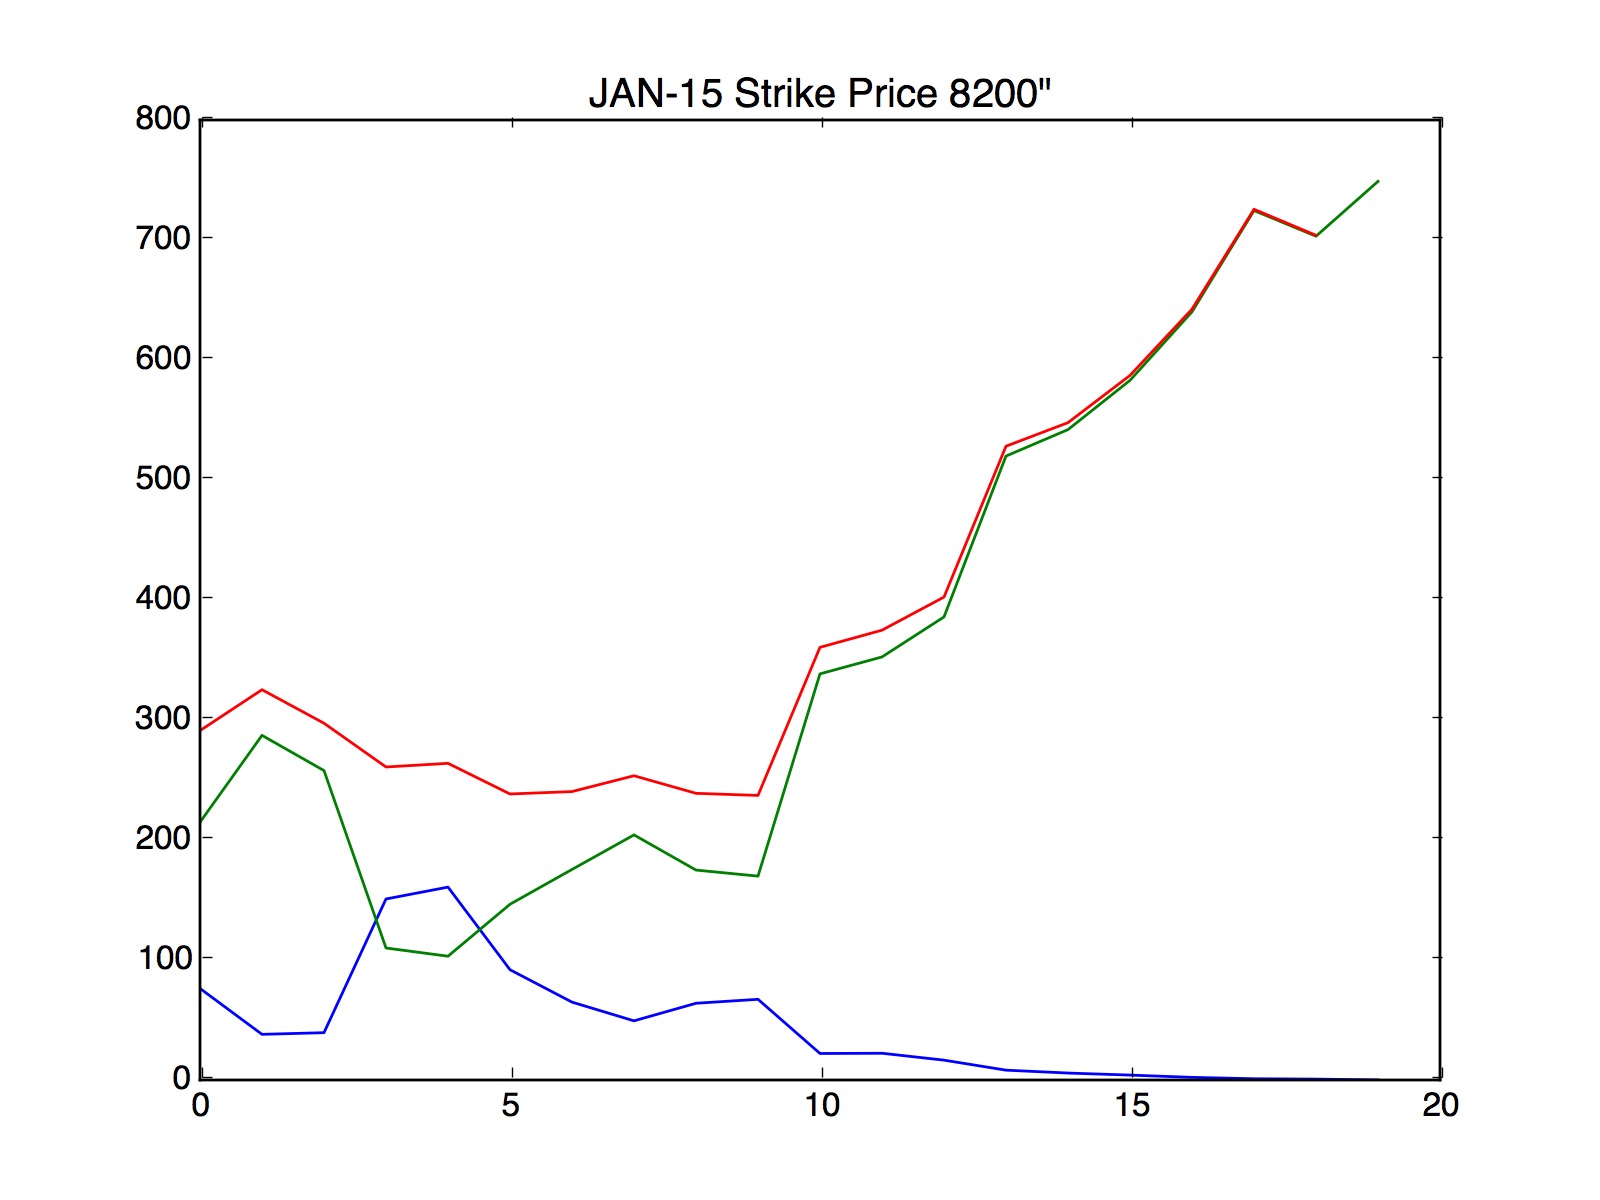
Option charts for last month expiry.
3:26 AM
analysis
,
option trading
,
technical analysis
No comments
Option charts for last month expiry. Strike Price choosen is Setltement Monday means Monday before Thursday expiry.
Read More
← Newer Posts
Older Posts →
Home
Pageviews
Blog Archives
Popular
Blog Archive
▼
2022
(4)
▼
November
(1)
Trading Gaps using previous day setup
►
March
(1)
►
February
(2)
►
2021
(2)
►
February
(2)
►
2017
(2)
►
October
(1)
►
June
(1)
►
2016
(47)
►
December
(15)
►
November
(3)
►
October
(3)
►
September
(2)
►
June
(2)
►
May
(6)
►
April
(9)
►
March
(3)
►
February
(4)
My Journey into markets
I started my journey 5 years back in stock market and I had my ups and downs. Like, most people I was also trying to find the holy grail bu...
Trade with Doji in intraday
It is similar to spinning tops but it has a very small body. It also represents indecision in markets. Neither bulls nor bears are in con...
Swing Trade in ICICI Bank
A bullish harami pattern has been formed in the icic bank on daily time frame. A bullish harami is formed when the previous bar is a...
How to trade with hammer in intraday
Hammer is a pattern which has small body compared to the tail. For intraday, we will look at 5 min time frame. It generally leads to tre...
Trade with spinning tops in intraday
Japanese candlesticks with a long upper shadow, long lower shadow and small real bodies are called spinning tops. The color of the real...
Trading with Shooting star in Intraday or delivery
It is single candlestick pattern It is the exact opposite of hammer. For reversal from uptrend to downtrend the following conditions shou...
Short straddle in BHEL and BankNifty
This strategy requires that you sell both call and put options of the same strike price for the same expiry date. This strategy makes prof...
Why people are not able to make money by investing?
The answer is impatience. If you buy 10 stocks, 5 of them are gonna rise and 5 of them are gonna lose(just taking a 50% scenario). Peopl...
How to check institutional holding of stocks
This link will give you the list of stocks with highest FII holding. https://trendlyne.com/stock-screeners/shareholding/FII/increase/Q2-2...
Technical analysis - Intraday trading in india
The following links are good for learning price action. They have enough examples to clear things up. http://zerodha.com/varsity/wp-cont...