Friday, April 22, 2016

Trade with spinning tops in intraday


Japanese candlesticks with a long upper shadow, long lower shadow and small real bodies are called spinning tops. The color of the real body is not very important.

The pattern indicates the indecision between the buyers and sellers.

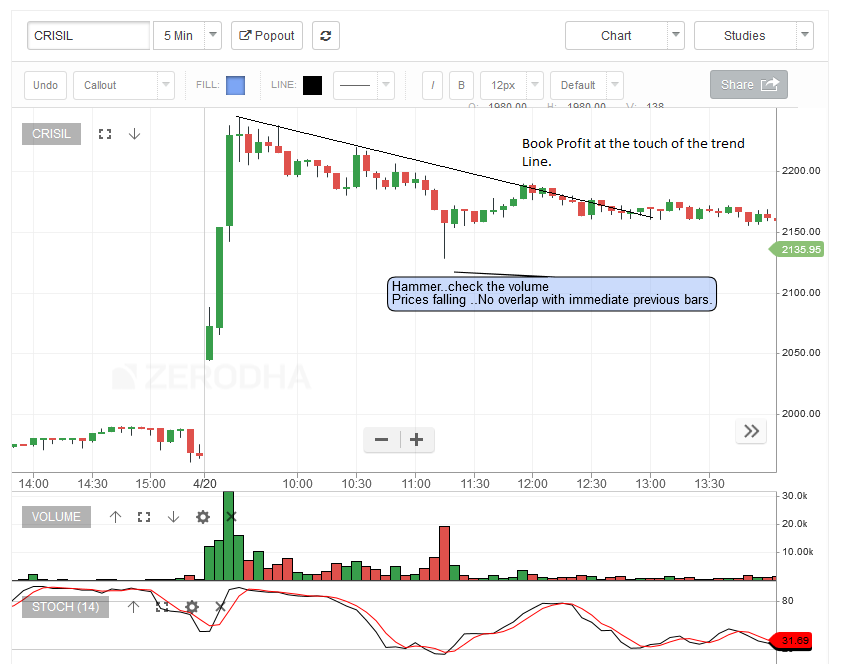
If we are already holding a position and in good profit then we can book profit as the trend might might reverse from this point.


Thursday, April 21, 2016

Trading with Shooting star in Intraday or delivery

It is single candlestick pattern It is the exact opposite of hammer.

For reversal from uptrend to downtrend the following conditions should met.
1. Occurs after uptrend.
2. Should form at resistance
3. Ofcourse high volume (buyers should get trapped).

The name shooting star is apt as the prices keep falling after that like a shooting star until it touches to the ground (which is support in our case).

Wednesday, April 20, 2016

How to trade with hammer in intraday

Hammer is a pattern which has small body compared to the tail.

For intraday, we will look at 5 min time frame.

It generally leads to trend reversal from downtrend to uptrend but there are some other conditions that should occur for this to happen.
1. Volume should be there.
2. Previous downtrend.
3. Hammer with a good tail.
4. It should not overlap with at least previous 14 bars. For this I use stochastics oscillator.

This pattern formed today in Crisil.


Another trade that I made on Lupin using a hammer pattern.


Sunday, April 17, 2016

Swing Trading with McDowell-N


There is a hammer formation on the weekly chart of McDowell although it does not have a good tail. But, we have other compelling reasons to take this trade. The stochastics is still in oversold region and  hammer is formed at the support.

Also on daily, there was a bullish engulfing pattern at the support and the stock has already started going up.

So, we are bullish on this stock with a target of 2610 and a SL of 2250.


No matter how bullish we are and bullish chart patterns are formed we should always use a stop loss.


Wednesday, April 6, 2016

Intraday Trading in india DLF

Buy DLF target 117.

There is a bullish engulfing pattern and a positive divergence in the stochastics oscillator.

Intraday trading in india

Trading with divergence in oscillators.


For high probability, look for atleast 3 bumps in the stochastics oscillator.


Saturday, April 2, 2016

Technical analysis - Intraday trading in india


The following links are good for learning price action. They have enough examples to clear things up.

http://zerodha.com/varsity/wp-content/uploads/2015/05/module2-1.pdf

http://zerodha.com/varsity/wp-content/uploads/2015/05/module2.2.pdf

NSE has got one module for technical analysis.

http://www.nseindia.com/content/ncfm/CourseOutline_TAM.pdf


For intraday trading, we will look at 5 min time frame. But, before making any trade, we will take  a look at higher time frame and then we will trade in the direction of trend in the Higher time frames.

With above, we need to follow proper risk management too. In intraday trading, it is preferred to have a risk reward of atleast 1:2 which means if you buy @100 then Stop loss will be @99 and target should be atleast @102.